Using Gscope Applications
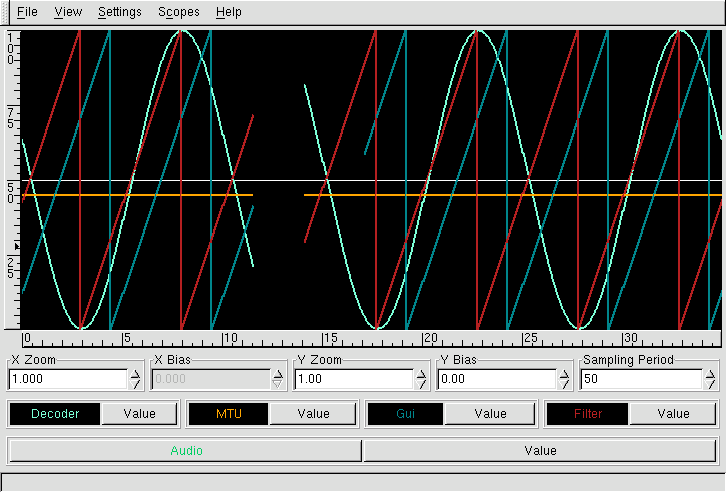
When a gscope application is run from the command line, you will see the main window, as shown in Figure 1. This window is the GtkScopeApp widget. Within this widget, the canvas with the black background is the GtkScope widget. The GtkScopeApp widget has a menubar, the GtkScope canvas with the X and Y axis rulers, the zoom and bias factors and polling period of the scope and display parameters for each signal. Each of these elements are described below.
The Menubar
The menubar consists of the File, View, Settings, Scopes and Help menus. These menus are described below.
File
- New
Creates a new scope. The user is prompted for a file. Data is displayed from this file in Playback Mode. The format of the input file is described in Recording File Format.
- Close (Ctrl-w)
Closes this scope. The GtkScopeApp widget is destroyed.
- Quit (Ctrl-q)
Quits the gscope application.
View
- Start Program
Starts or stops running the program. The program is specified as a callback function together with a period argument to gscope_new. This callback function is invoked by the Gscope object every period milliseconds. The program is typically used in polling mode and generates the signals that are displayed on the scope. If the function and the period are not specified, the program is not started and the toggle button will not press down.
- Start Polling
In polling mode, starts or stops polling (and displaying) data. Note that generally the program has to be started (see above) and the polling enabled to view useful data. Stopping the polling enables the user to get a static view of the signals. However, it does not stop the program and thus signals will still be generated.
- Record Data
Record signal data to a file. Data can only be recorded to a file in polling mode. The data is recorded in a file format that is described in Recording File Format.
- Frequency
Toggle between frequency display and time display. In frequency display mode, the scope displays the signal frequency (using an FFT). In time display mode, the signal is displayed over time. Note that the frequency mode does not work entirely correctly right now.
- Hide Signals
Toggle the display parameters for each signal, the scope zoom and bias and the polling period.
- Clear Display
Clears the display.
Settings
- Preferences
Configure the application. gscope configuration allows arbitrary application or signal parameters to be set by the user and is thus not what is considered to be typical application configuration. Gscope programmers specify application parameters using an interface described in Parameter Interface.
- Line Mode
Mode in which lines are drawn. Lines can be drawn in the GtkScope widget in Step, Line, Point or Vertical modes. In the Step mode, a line is drawn horizontally and then vertically between consecutive signal data points. In the Line mode, a straight line is drawn between consecutive signal data points. In the Point mode, data points are drawn but not connected by a line. In the Vertical mode, a vertical line is drawn from the bottom of the scope to the y-coordinate of the signal data point.
Scopes
- Scope Name 1, Scope Name 2, ...
Show the names of all the scopes. Clicking on a scope name toggles the display of the scope window with that name. The scope name associated with the current window has an asterisk attached to the name. When a scope is not visible, the scope name is surrounded by brackets in other scope menus. When all scopes are closed (not displayed), the application is sent a DELETE_EVENT signal (See Close).
Help
- Manual
Bring up this manual.
- About
Briefly describe this application.
The GtkScope Canvas
The GtkScope canvas displays the signal data. It is surrounded by an x-axis and a y-axis ruler. In the polling mode, the x-axis ruler is sized in seconds. In the playback mode, the x-axis is sized so that each pixel represents one sampling period (see the section called Sampling Period). For default values of the zoom and bias factors (see the section called Zoom and Bias Factors), the y-axis is sized so that it ranges from 0 to 100. A left click on any part of the canvas will popup a window that displays the x-axis and the y-axis coordinates.
Zoom and Bias Factors
The zoom and bias factors allow scaling and translating the signal data. The zoom parameter scales the data and by default is set to 1. When the Y Zoom scale is different from 1, the y-axis is scaled accordingly. For instance, when the y-zoom factor is set to 0.5, the y-axis ranges from -50 to 150 (range is two times the default and centered at 50). The bias parameter translates the data and by default is set to 0. The X Bias scale is active in the playback mode only since it does not make sense to translate signal data along the time axis in polling mode. Its value ranges from 0 to 1. The Y Bias scale ranges from -2 to 2. A unit change in the y-bias value translates the scope data by the size of the y-axis (which depends on the y-zoom value) and the y-axis is translated accordingly.
The zoom and bias factors can be changed by using the spin buttons or by directly typing into the text area. However, to activate the change in value, the return key must be pressed. When the values are changed but not activated, the background color of the text area is changed from its original color. When the return key is pressed and the new value is activated, the background color of the text area is restored to its original color.
Signal Display Parameters
The display parameters for each signal are shown below the zoom and bias factors. For instance, 5 signals are shown in Figure 1 in the section called Using Gscope Applications (actually the Audio signal is hidden). Each signal has a name and a color associated with it. The signal name is shown in the signal color in the Signal Name button. Left clicking on the Signal Name button toggles display of the signal. When the signal is not displayed, the Signal Name button has a light background as shown by the Audio signal in Figure 1 in the section called Using Gscope Applications. To the right of this button is the Value button. In polling mode, when this button is toggled, the signal value is continuously displayed.
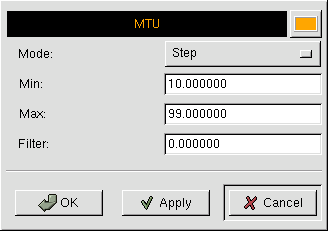
Display options for each signal can be set by right clicking on the Signal Name button. This action will pop a window shown in Figure 2. The name and the color of the signal are shown at the top of the window. The signal color can be changed by clicking on the top-right button. The Mode button determines the mode in which lines are drawn (see Line Mode in the section called The Menubar). Note that this mode button allows each signal to be drawn in a different mode. The next two values Min and Max are specified as the minimum and the maximum values of the signal data. For default values of the zoom and bias factors (see the section called Zoom and Bias Factors), the minimum value of the signal is shown on the bottom of the scope and the maximum value of the signal is shown on the top of the scope. Note that the signal can generate values above the maximum or below the minimum. However, these values will not be visible in the scope for default zoom and bias factors. When the minimum and the maximum values are changed, they can be activated by pressing the return key or by clicking on the Apply or the Ok buttons.

